
Tell Stories With Data
Your data or mine?
With a unique combination of quantitative research, marketing and social media skills, I can not only get you the original data you need to rise above the fray, but also turn it into an irresistibly compelling story. Or I can work with the data you already have–like transaction data, social media metrics, app usage or customer feedback–to find the story that will win you new audiences and attention.
Data drives conversations
My content marketing projects drive social conversations because I bake the social strategy into the content. Each piece features tweetable links, bloggable excerpts and shareable infographics created by me or an independent designer. And it comes with a social media promotion plan calibrated to build your network and your brand.
The right form for your data-driven content
You can use data to power content like:
- White papers, reports and ebooks that generate media attention and leads
- Shareable infographics that present new insight
- Blog posts in an authoritative voice
- Presentations that make audiences take note
- Social media shareables like charts or data factoids
Data journalism for content marketing
Content marketers at the world’s most innovative companies and publications turn to me for data journalism that sets their content apart.
Here are some examples of my data-driven work.
No Results Found
The page you requested could not be found. Try refining your search, or use the navigation above to locate the post.
Power your content with data
Ready to start turning data into great, compelling content? Here are some of my top tips on how to tell great stories with data.
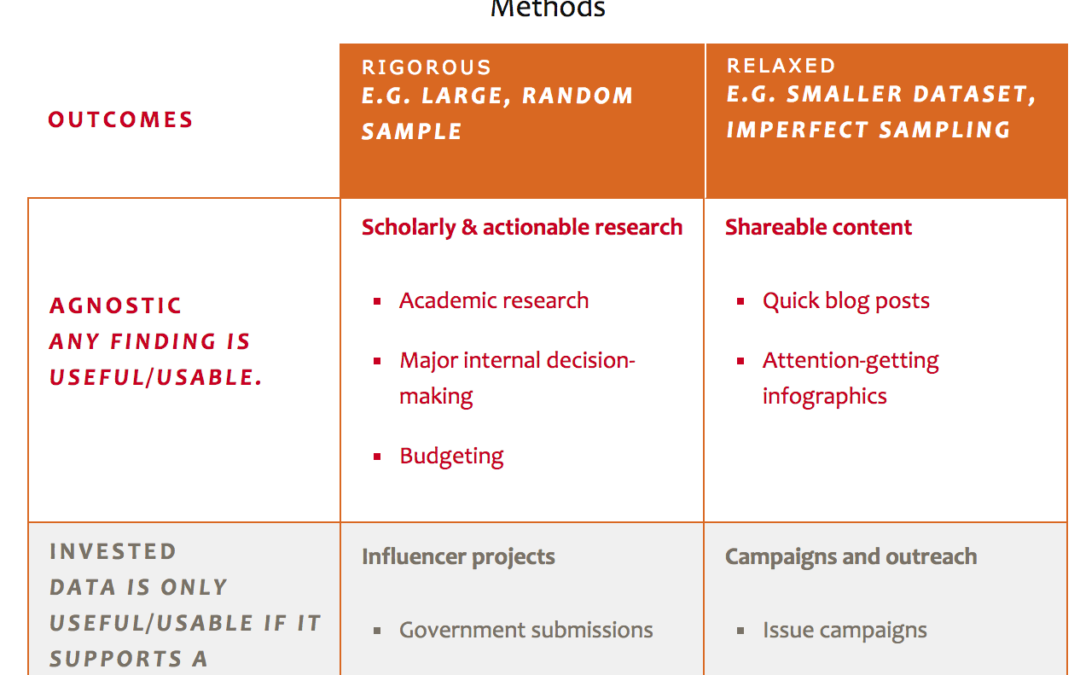
Choosing research methods for data-driven storytelling
This blog post does not represent Vision Critical. In fact, I think some of my colleagues are going to argue with me vigorously over this one. Rigorous data gathering and analysis can get in the way of effective storytelling by non-profits. That proved to be the most...

Is this an ice cream? A 2×2
It has recently come to my attention that many people seem to be unable to recognize whether their preferred frozen dessert is ice cream. At last! A modern dilemma I can actually solve, thanks to this handy 2x2: Is it ice cream? Butterfat content 10 to...
Yelpless: What kinds of reviews get squelched by Yelp?
I'm an ardent (some might say pathological) Yelp user, and since I am incapable of putting anything in my mouth without first validating its viability on Yelp, I try to contribute back to the community by sharing my own perspectives and information, particularly on...

Is the Canadian media responsible for Western Canadian alienation?
What is the root cause of Western Canadian alienation? Contrary to common arguments, it's not because the rest of Canada fails to understand the West's "distinct history, economy and society", it's not due to the National Energy Program or even (as my friend and...

Bumper sticker conversation guide: 2×2 edition
This weekend my mind got blown a tiny bit by this unexpected combination of bumper stickers. Naturally, I facebooked the photo, and my friend Steve challenged me to fit this phenomenon into a 2x2. But as with any 2x2, the structure of the table should be determined by...